Someone asked me a good question recently: "What is a crash here in Colorado Springs?" It is worth answering carefully, because the word gets used constantly and defined almost never. When you look at what has actually happened here over 30 years, the honest answer surprises most people.
When people say "crash," they picture a price cliff: a number that falls a lot, fast. That is a fine mental model for a stock, which trades every second, has no lock-in, and can be sold instantly. A house is none of those things. Applying the stock-market definition to housing is where the fear usually goes wrong, so let us start with what the local price record actually shows.
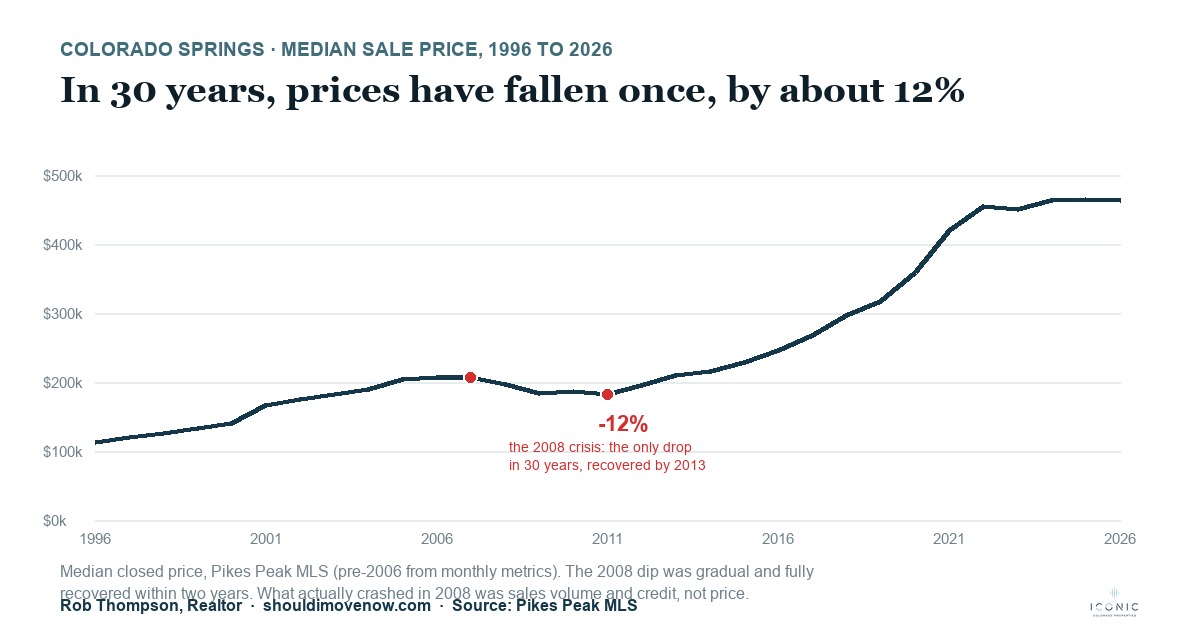
From 1996 to today, the Colorado Springs median sale price went from about $112,000 to roughly $463,000. In that entire stretch it declined one time: from a pre-crisis peak near $206,000 to a low of about $182,000 in 2011. That is a drop of about 12%, it played out gradually over roughly five years, and it had fully recovered by 2013.
Sit with that. The one and only price decline in three decades happened during the worst national housing collapse in a century, the event that leveled markets like Phoenix and Las Vegas by 40% or more, and here it was a soft 12% that healed in two years. By the stock-market definition of a crash, Colorado Springs has never had one. Not in 2008, and not in the recent cooling, when prices went essentially flat (about $455,000 in 2022 to $463,000 now) rather than falling.
Fair objection: pull up a monthly price chart and you will see the line jump 10%, and it looks like something crashed. It did not. That chart is measuring the wrong thing. A monthly median or average price does not tell you what homes are worth. It tells you which homes happened to sell that month.
Only about 1,060 homes close here in a typical month. When a few more high-end homes sell, the median and average jump; when more starter homes sell, they fall. Add seasonality, since spring sells bigger and pricier homes than winter, and that small sample, and the monthly line wobbles in a band without any single home changing value. In our own data over the last three years, the monthly median moved 2.2% in an average month, as much as 6.5% in a big one, and its full peak-to-trough range was about 10%. That 10% is exactly what people are pointing at.
Now watch what the same data does once you remove the noise. Across those same three years, the 12-month-average median went from about $461,000 to $460,000. That is negative 0.3%. The monthly line spanned 10% while the real trend moved essentially zero, and every dip was followed by a bounce within a month or two. A crash does not bounce back in 30 days. Noise reverts; a crash trends.
So here is our methodology, and it is deliberately conservative:
Something clearly broke in 2008. It just did not break the price. Two other things did the breaking:
That is the real shape of a downturn here: a collapse in the number of transactions and a freeze in credit, with price as a minor, lagging afterthought. Our sales velocity data shows this pattern repeat in every soft patch. When it gets hard to buy here, the market does not slash prices. It simply stops moving.
There is a subtler point too. A market can correct without the price ever falling. Since 2022, the nominal median has been flat, but the payment on that same home rose sharply as rates climbed, and inflation ate away at the dollars underneath. In real, affordability-adjusted terms, buyers have already absorbed a meaningful correction. It just never showed up as a red line on the price chart, because the thing that hides it, sub-4% locked-in owners who will not sell, keeps homes off the market and prices sticky.
Here is the honest definition, built on the local record: a crash here is not a price event. It is a liquidity and credit event marked by forced sellers, frozen lending, and a collapse in transactions. The price decline, if it comes at all, is small and slow, because three things hold prices up in this town:
When someone asks whether Colorado Springs is going to crash, they are almost always watching the wrong number. A 20% price drop is not what history says to expect here. What history says is that a downturn shows up as a freeze: fewer sales, longer days on market, more negotiation, and a shift toward VA, FHA, and cash. The real question is never "will prices fall." It is "will jobs and credit hold." Watch the employment picture and the lending market. Those are the things that would actually turn a Colorado Springs slowdown into something worse, and in 30 years, they never quite have.
Methodology: median sale prices, volume, and financing mix are from Pikes Peak MLS closed sales (pre-2006 prices from monthly market metrics). Figures are nominal unless noted. This is market analysis, not a forecast. Analysis by Rob Thompson, Realtor, Iconic Colorado Properties.
Get the next data drop by email
Original Colorado Springs market numbers you will not find anywhere else. No spam, just the data.
Have questions about the market?
Get personalized guidance from Rob Thompson.
Get daily email alerts when new homes matching your criteria hit the market.
Create a free account to save listings and get notified when new homes match your criteria.
No spam, just houses.
Get an accurate homeowner's insurance estimate from Patrick Murakami at Main Street Insurance - no obligation.
Get connected with a trusted local lender for pre-approval, rate quotes, or financing questions - no obligation.