Colorado Springs housing market insights and home buying tips.

FeaturedSeptember 23, 2026
The best time to sell a house in Colorado Springs is April or May: spring listings sell in about 6 days, at the highest median price and with the fewest seller concessions. Based on ~175,000 MLS sales, 2015-2025.
Read more →

FeaturedApril 19, 2026
The connection between M2 money supply and housing costs in Colorado Springs - one chart that explains why homes cost what they do, and where the market is heading.
Read more →
Draft
When does M2 money supply stop affecting Colorado Springs housing prices? A data-driven analysis of the transmission mechanism and what breaks it.
Read more →
Draft
20 years of seller concession data from 265,000+ Colorado Springs transactions. How concessions track with market cycles, rates, and loan types.
Read more →
Draft
Are sellers really outnumbering buyers in Colorado Springs? A data-driven look at absorption rates, pending ratios, and what the buyer-to-seller balance actually looks like.
Read more →
October 03, 2026
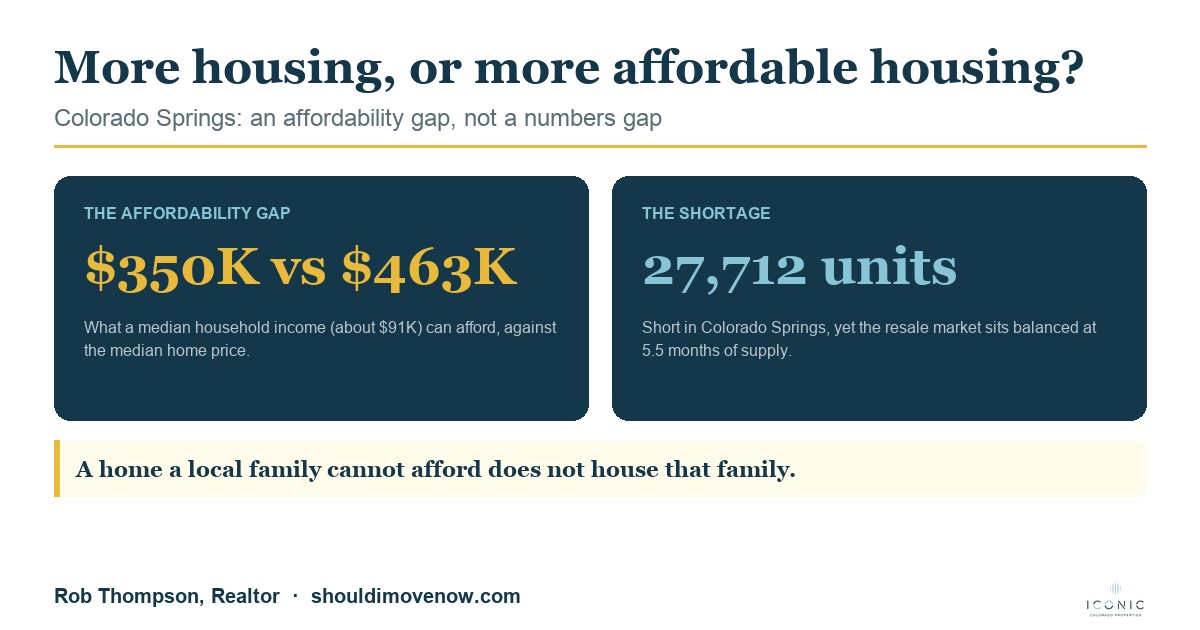
The Colorado Springs housing shortage is real, but the data shows it is an affordability gap, not a raw-numbers gap: months of supply by price band, the income-to-price gap, and why building market-rate homes at a $460K average will not close it.
Read more →
September 28, 2026
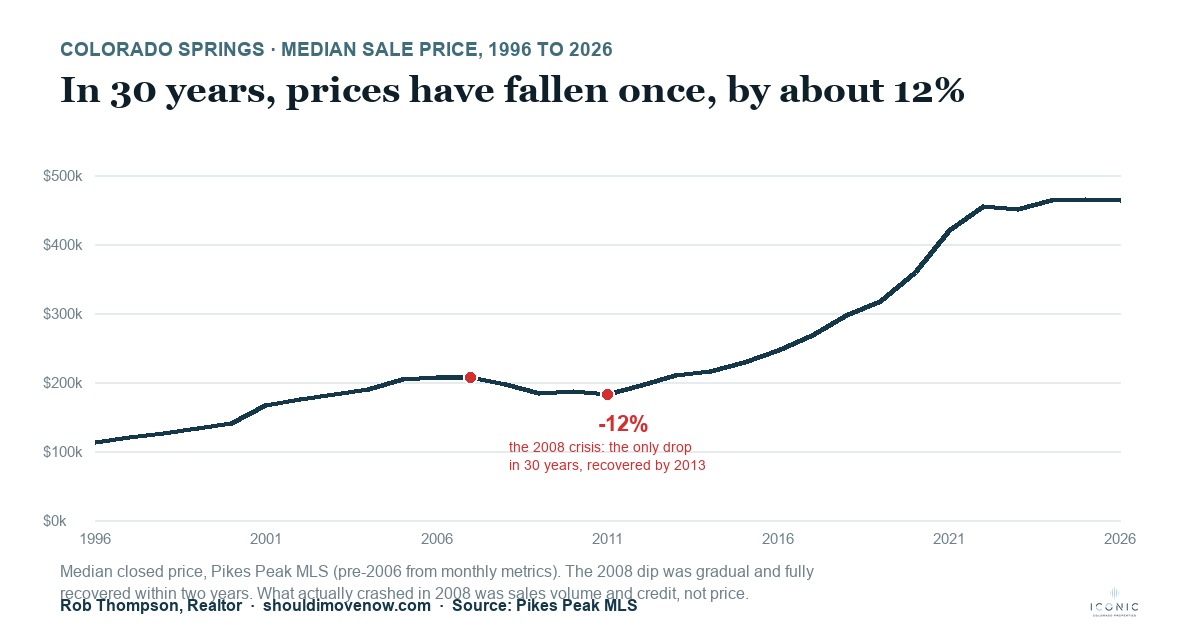
Someone asked what a housing crash looks like in Colorado Springs. In 30 years, prices have fallen once, by about 12%. What actually crashes here is volume and credit, not price. The real definition, in the data.
Read more →
September 25, 2026
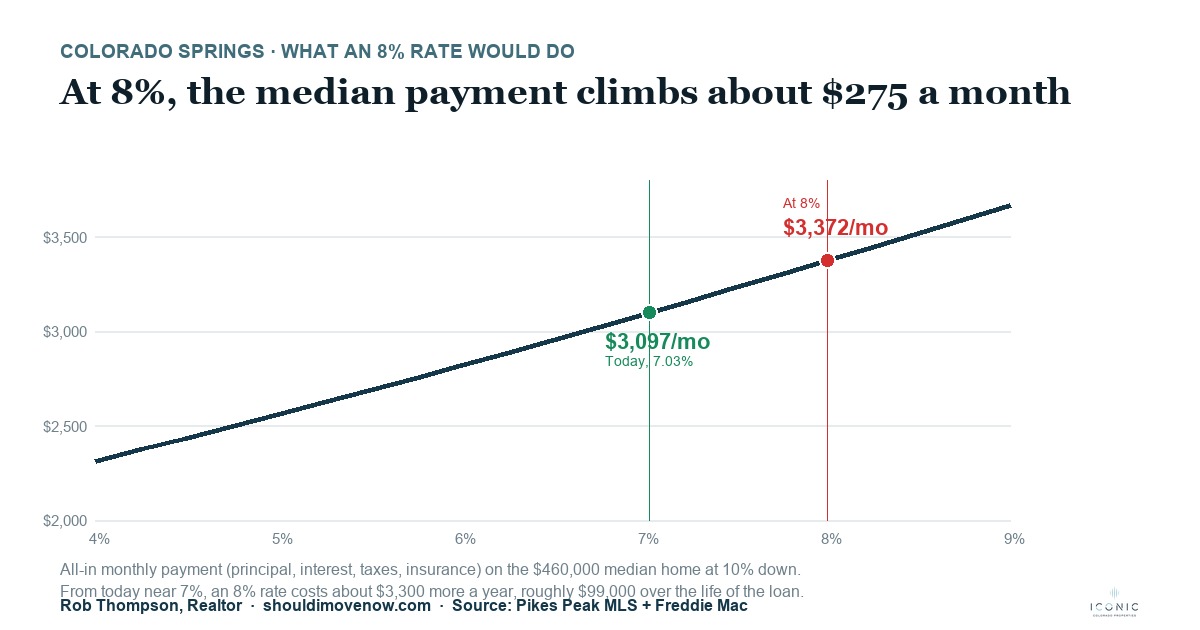
With the 30-year at 7.03%, an 8% rate would add about $275 a month on the median Colorado Springs home and price the median buyer out on paper. What 8% would really do to local sales volume, days on market, and prices, in the numbers.
Read more →
September 24, 2026
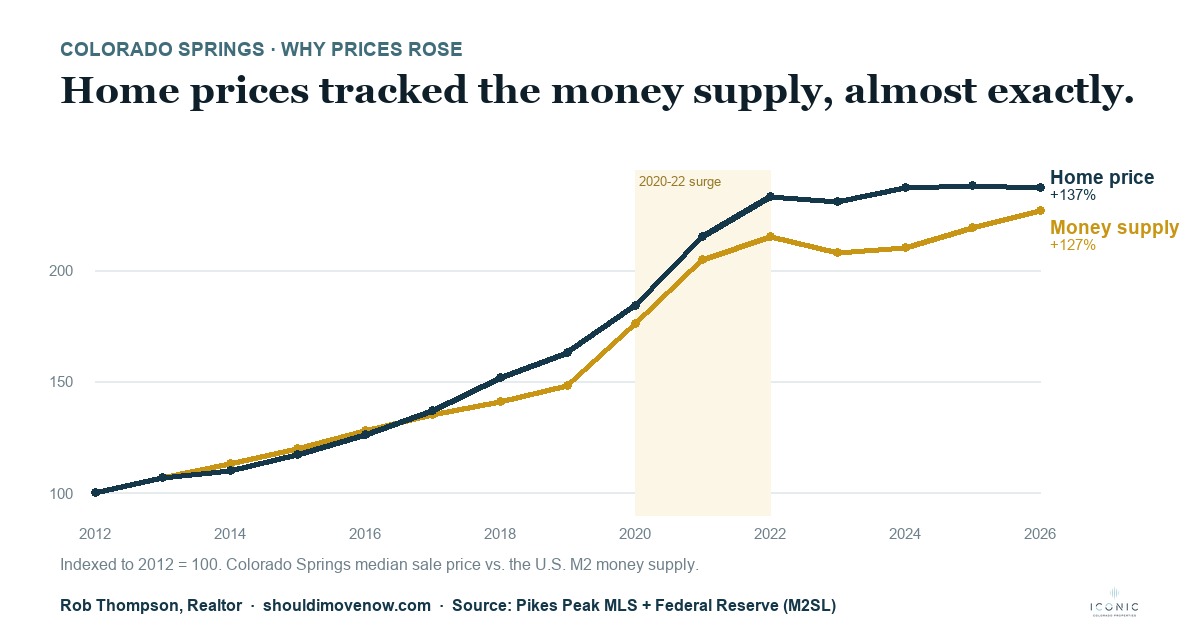
Why did Colorado Springs home prices explode since 2020? Our data shows the median sale price tracked the U.S. money supply almost exactly. It was a monetary event, not just a shortage, and prices went flat the moment the money did.
Read more →
September 24, 2026
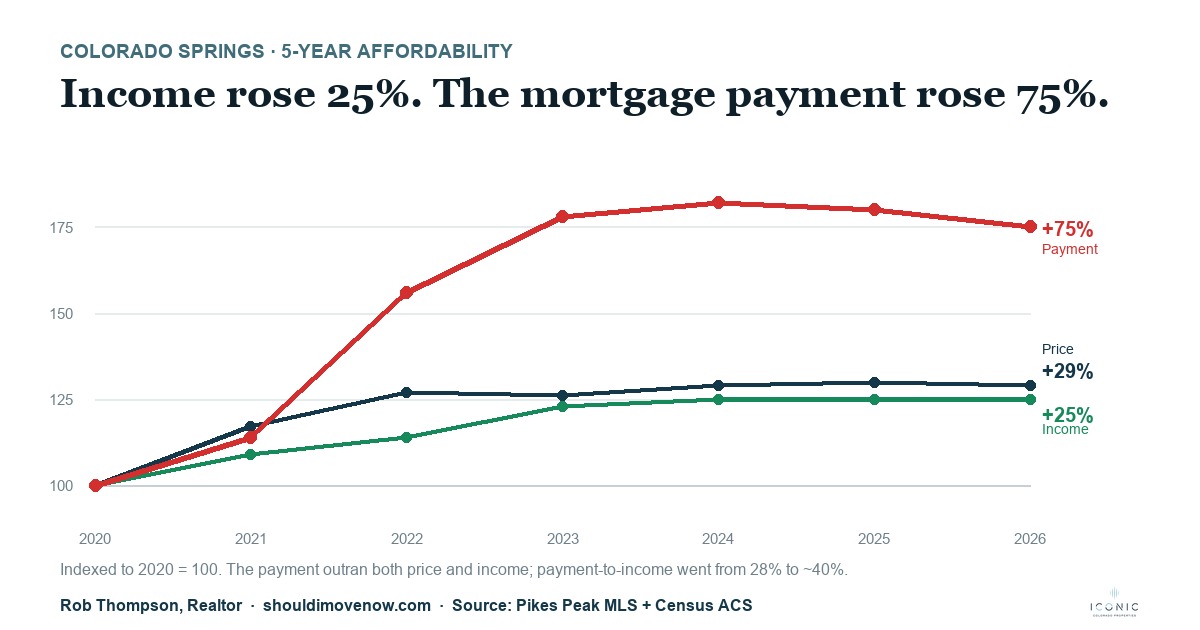
Colorado Springs affordability over 5 years: income rose 25% and home prices 29%, but the monthly payment rose 75% as rates jumped. Payment-to-income went from 28% to ~40%. It was the rate, not the price.
Read more →
August 13, 2026
What changed on Colorado Springs utility bills in 2026 and why: the new summer time-of-use rates, the five-year rate plan, and the six-year climb in electricity and natural gas prices, explained in plain language.
Read more →
July 30, 2026
Active listings vs closed sales by price band in the Pikes Peak region: months of supply from under 200K to 1M plus, and how much of the market a median income household can actually reach at today rates. Updated automatically.
Read more →
July 08, 2026
Colorado Springs home prices never crashed after rates spiked. Volume did. Four years of data on how the market repriced through inflation, time on market, and $25M a quarter in seller concessions.
Read more →
July 01, 2026
363 Colorado Springs leases, April to June 2026. Rents rose then flattened, but time-to-lease tripled (6 to 20 days) and rent per square foot fell every month. A data look at a loosening rental market.
Read more →